Data Studio
Generate live market dashboards from natural language, preview them, and publish shareable pages
🟢 Beginner friendly — Data Studio builds read-only dashboards. It never places trades, transfers funds, or asks for private keys.
Data Studio turns a plain-language market question into a small React dashboard app. You describe the view you want, the agent writes the plan and source code, builds a preview, and keeps iterating until the page works.
Use it when you want a live market board, earnings table, portfolio view, watchlist heatmap, price chart, K-line view, sentiment gauge, or any other shareable dashboard that should refresh from data sources instead of becoming a static report.
How it works
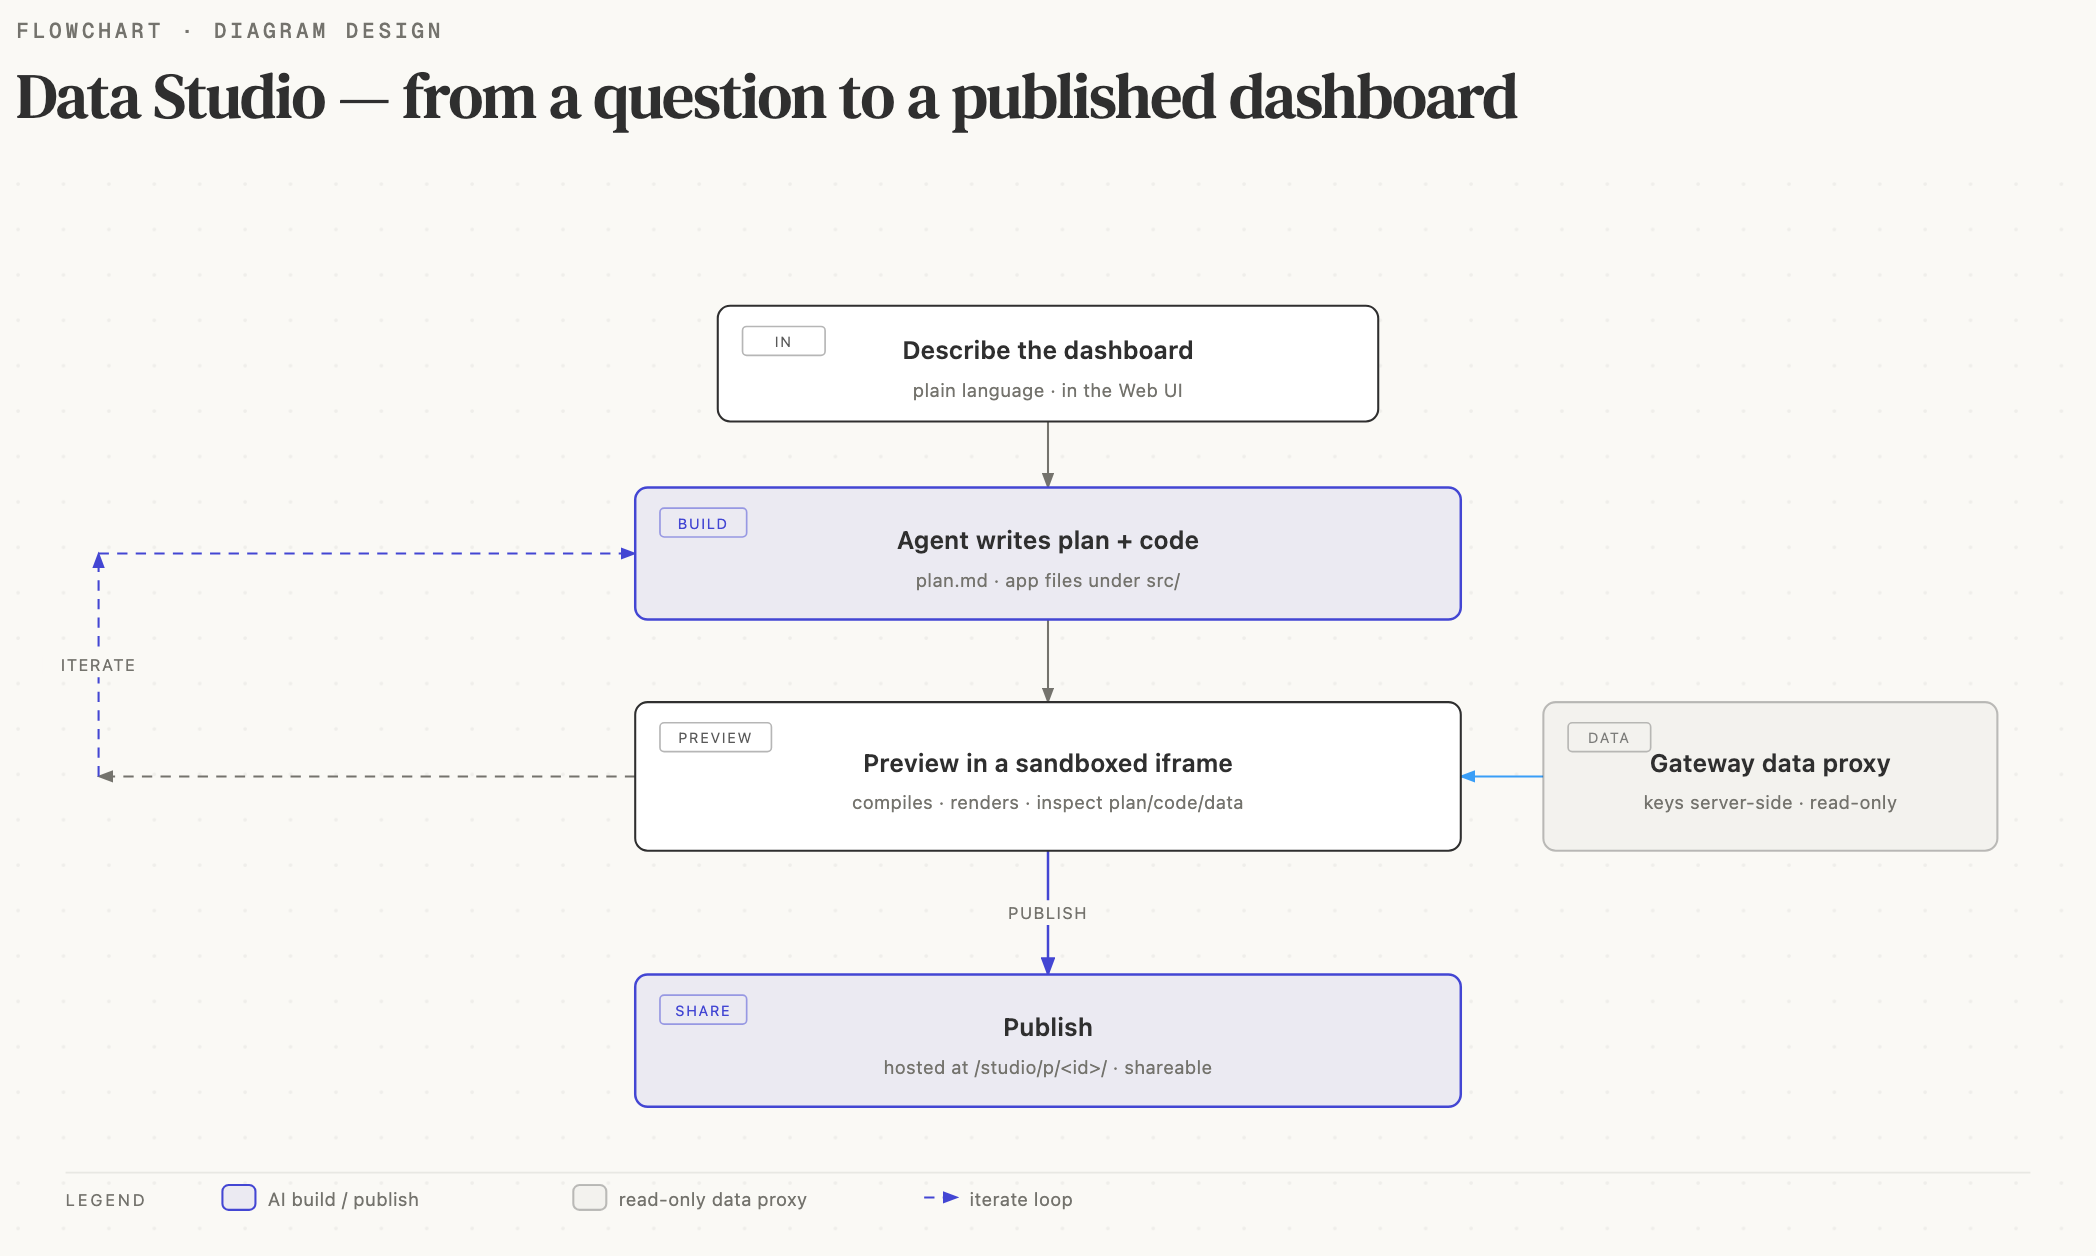
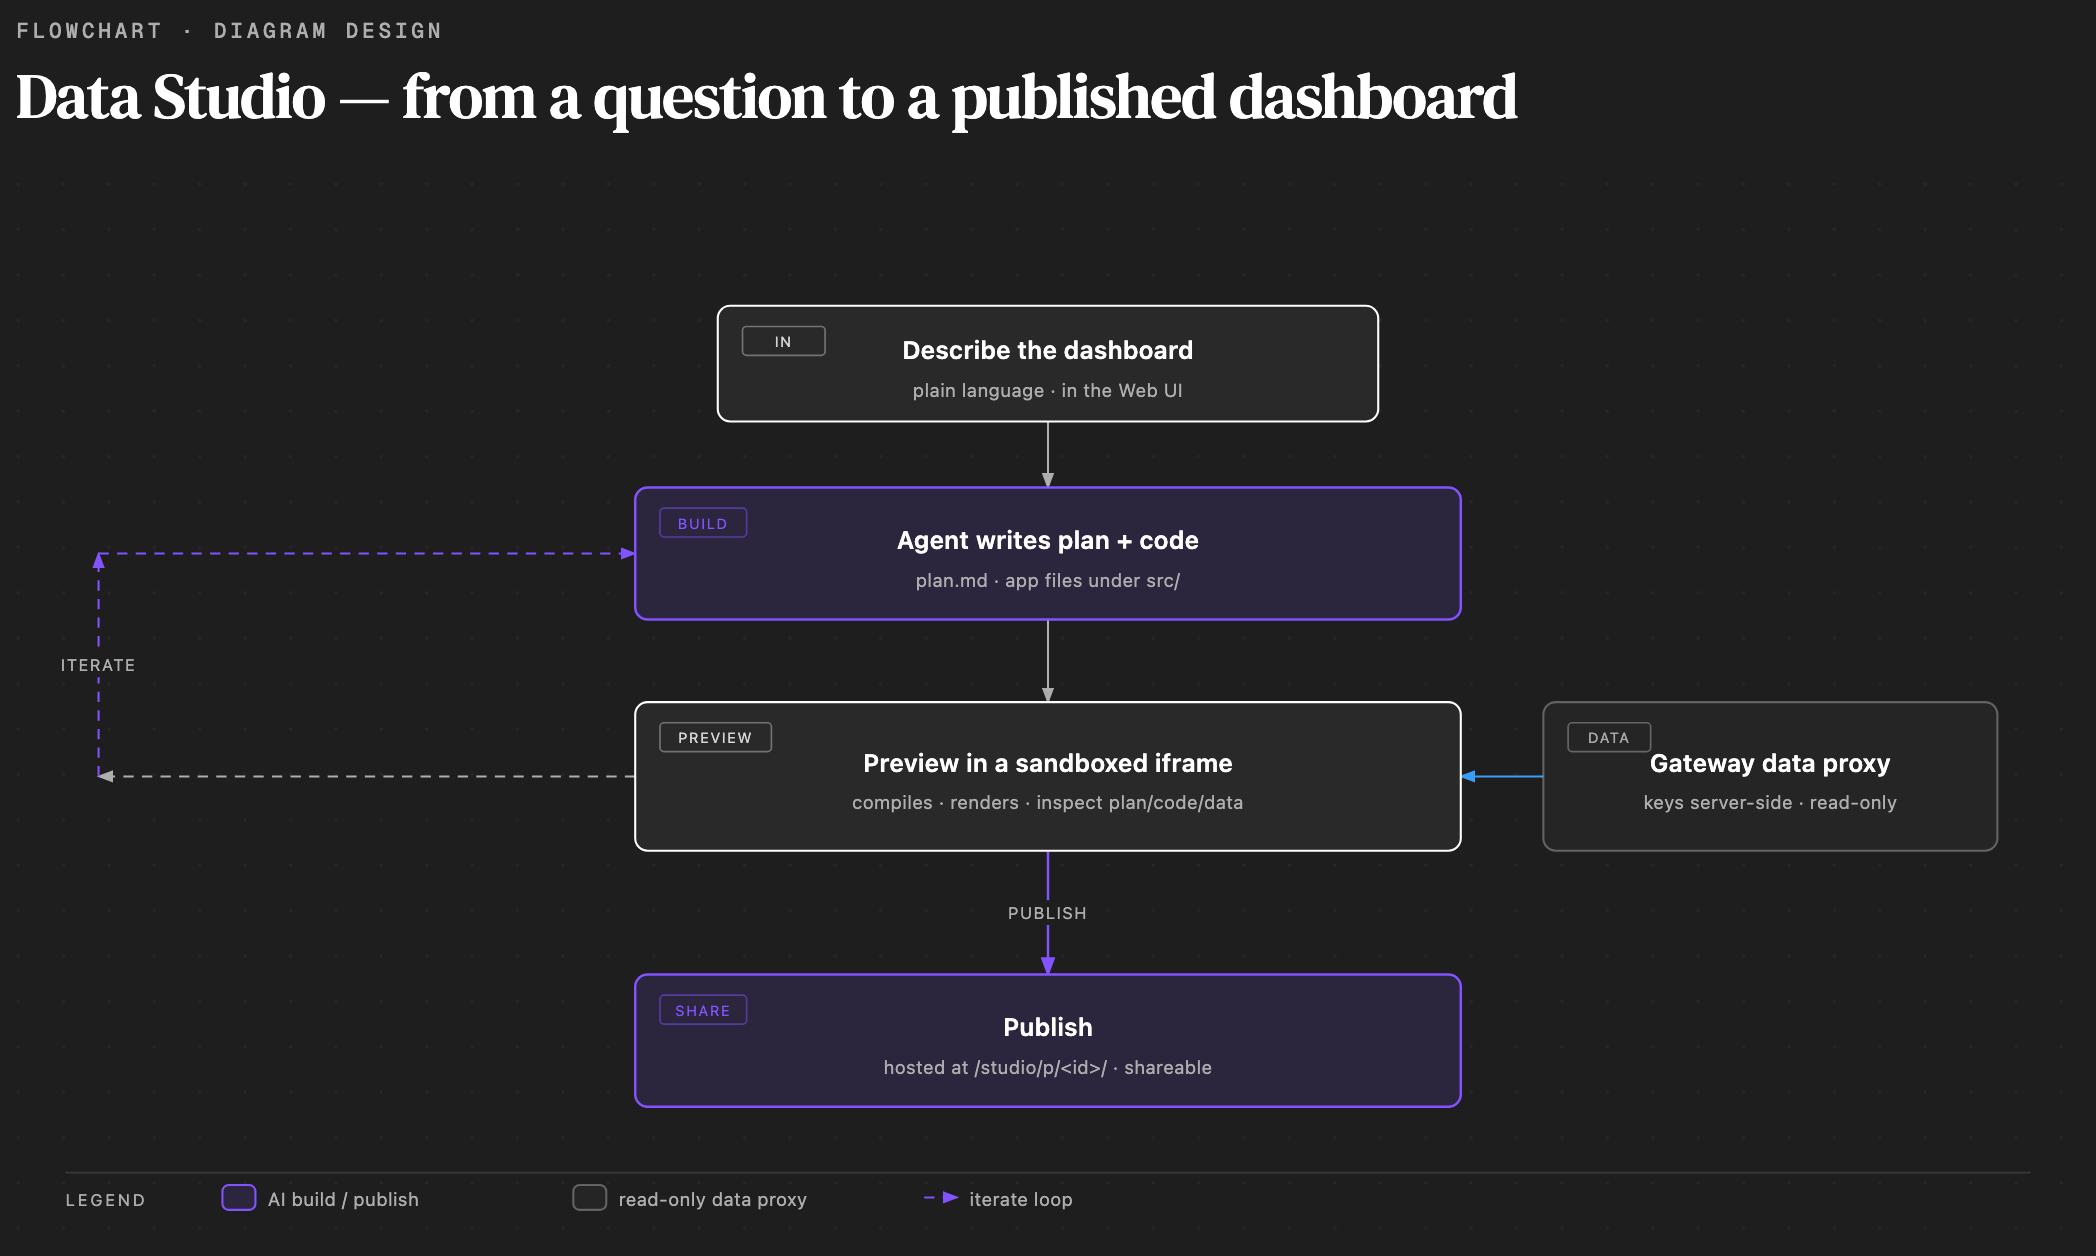
- Open Data Studio in the Web UI and describe the dashboard.
- The agent writes
plan.mdplus the app files undersrc/. - The Preview tab compiles the app and renders it in a sandboxed iframe.
- Use Plan, Code, Data & stats, and Settings to inspect what was built, review data access, and adjust API key configuration.
- Click Publish when the preview is ready. The published page is hosted at
/studio/p/<id>/and can be shared while the gateway is running.
The right-side chat stays attached to the project. Ask for edits in natural language: "make the table denser", "add a K-line chart", "switch the heatmap to market-cap weighted tiles", or "fix the runtime error from the logs".
Data access and API keys
Dashboard code reads live data through @minara/studio, not direct provider
URLs. The SDK routes requests through the gateway data proxy, and the gateway
injects provider credentials server-side.
- Public sources such as Binance public market data do not need an API key.
- Stock fundamentals, earnings calendars, and other premium datasets may need
keys such as
FMP_API_KEYorCOINGECKO_API_KEY. - Configure keys in Settings → API Keys, or expose them as environment variables before starting the gateway.
- If a required key is missing, Data Studio should show an actionable error telling you to configure the key and rebuild or refresh.
Never paste API keys into generated dashboard code. Generated projects should only reference the data source name, path, and safe query params.
Preview, runtime errors, and bugfixes
Build errors happen before the page loads. Runtime errors happen after compile,
while React renders inside the preview iframe. Data Studio captures runtime
errors to the project root under runtime-logs/.
When the preview shows a runtime error, use the bugfix shortcut beside the chat
send button. The agent reads the latest log with data_studio_read_logs, uses
the message and stack trace as the primary source of truth, applies the smallest
fix, and rebuilds.
UI and chart components
Generated dashboards should use the fixed @minara/studio primitives instead
of hand-rolled styling:
- Layout and states:
DashboardShell,Panel,MetricCard,DataTable,LoadingState,EmptyState,StatusBadge,ThemeToggle. - Formatting:
formatNumber,formatPercent,formatUsd, andtoFiniteNumberfor provider values. - Charts:
LineChart,AreaChart,BarChart,HorizontalBarChart,StackedBarChart,DonutChart,KLineChart,SparklineChart,AssetHeatmapChart,MatrixHeatmapChart,GaugeChart,RadarChart,ScatterChart,BubbleChart,TreemapChart,CalendarHeatmapChart,WaterfallChart,BoxplotChart, andMixedLineBarChart.
These components wrap ECharts internally and apply Minara's design tokens for fonts, surfaces, borders, tooltip styling, positive/negative colors, and light/dark mode. The generated app should map data into component props, not write raw ECharts options.
Theme behavior
Data Studio follows the Web UI theme. A dashboard opened in the preview receives
the current light or dark mode from the parent page, and published pages
fall back to the user's system color scheme when opened directly.
Every generated dashboard includes a small ThemeToggle in the top-right by
default. In the embedded preview, switching it also tells the parent Web UI to
switch. In a published page opened directly, it only changes that page.
Safety boundary
Data Studio is for read-only visualization and delivery. It can request market data through approved proxy sources and generate files inside the project, but it must not:
- call wallet, trading, swap, withdraw, or order tools;
- connect MetaMask, WalletConnect, or any browser wallet;
- embed secrets in code;
- fetch arbitrary third-party URLs from inside the iframe.
For trade execution, use Chat, Portfolio, Trading, Strategy Studio, or Autopilot, where the normal preview-and-confirm fund-moving gates apply.